Fix downtime automatically — not just detect it

Pay As You Go

Only pay for what you use — free usage included

60s Interval

Check your services every 60 seconds

9 Regions

Global monitoring from 9 data centers


How It Works

What happens when your site goes down?

1

Responder

Issue Detected

60-second checks across 9 regions detect downtime within a minute. Your team is alerted instantly via your preferred channels — email, SMS, chat, or webhook.

2

Analyzer

AI Analyzes Logs + Metrics + Git History

AI pulls error logs from your error tracking tools, checks analytics, reviews recent deployments, and correlates everything to understand what went wrong.

3

Analyzer + Fixer

Root Cause Identified

Analyzer identifies the root cause and recommends a fix. Fixer independently verifies — both must agree before any action is taken.

4

Fixer

Executes Workflow

If both agents agree, Fixer executes the resolution workflow — rollback, restart, scale, or any custom action you've configured.


Transparent Pricing

AI pricing, clearly explained

AI Analysis — $0.15

  • Downtime: One analysis per incident, automatically
  • Anomalies: Only triggered when needed — not every anomaly

AI Resolution — $1.00

  • Only during downtime, never anomalies
  • Requires dual agreement — Analyzer and Fixer must both approve
  • No charge unless a workflow actually executes

The Math

How Uptivus saves you money

Cost of Downtime

$5,600/minute

— Gartner average for mid-size companies

  • 30-minute outage = $168,000 lost
  • Manual diagnosis takes 30–60 minutes
  • Engineers pulled from planned work
  • Customer trust eroded with each incident

Typical Incident on Uptivus

$1.15/incident

Analysis ($0.15) + Resolution ($1.00)

  • Detected in 60 seconds
  • Root cause in under 2 minutes
  • Automated fix executed immediately
  • Total downtime: minutes, not hours

Comparison

Beyond basic monitoring

CapabilityBasic MonitoringUptivus
Uptime checks
Alert notifications
Multi-region checksSome9 regions
Status pagesSome
AI root cause analysis
Error log correlation✓ (6+ tools supported)
Git deploy correlation✓ (Major providers)
Anomaly detection✓ (Watchdog agent)
Automated resolution✓ (Fixer agent)
Visual workflow builder

Fluenik Product

Uptivus

Five AI agents that monitor your uptime around the clock, analyze incidents, and resolve issues automatically — so problems are fixed before your customers notice.

WebWindowsmacOSLinuxAndroidiOS
ChatEmailWebhook
# 1. Add a monitor from the dashboard
Monitor: "Production API"
URL:     https://api.example.com/health
Type:    HTTP  |  Interval: 60s

# 2. Connect your alert channels
→ Team chat, email, SMS, or
  connect to anything via webhook

# 3. You're live — alerts flow instantly

Start monitoring in under 5 minutes

Add your first monitor through the dashboard, connect your team's alert channels, and you're live. With webhooks that connect to anything, alerts flow wherever your team already works — no code required.

DashboardConnect to AnythingDesktop AppMobile App

Features

Everything Uptivus monitors, routes, and reports

Monitor everything that matters

SIX MONITOR TYPES

HTTP, API, Keyword, Port, Ping, and Heartbeat — all with 60-second intervals.

CUSTOM STATUS PAGES

Branded public pages with your theme, images, and service components.

FLEXIBLE SCHEDULING

Per-monitor frequency, timeouts, and retry logic to reduce noise.

Featured Capabilities

HTTP MonitoringAPI MonitoringKeyword MonitoringPort MonitoringPing MonitoringHeartbeat Monitoring
Monitor everything that matters

Alert where your team already works

MULTI-CHANNEL ALERTS

Email, SMS, and push notifications with escalation flows.

CONNECT TO ANYTHING

Team chat, automation platforms, webhooks, and more.

CUSTOM WEBHOOKS

Send event payloads to your own APIs and incident pipelines.

RESOLUTION BUILDER

Design visual workflows that call any API and respond intelligently with if/else conditions and smart notification routing.

Featured Capabilities

Email AlertsSMS / Text AlertsPush NotificationsTeam ChatCustom WebhooksResolution Builder
Alert where your team already works

Reliable checks from every region

DISTRIBUTED CHECK NODES

Run checks from multiple regions to eliminate false positives.

CLOUD-NATIVE REDUNDANCY

Automatic failover keeps monitoring online across availability zones.

REGIONAL PERFORMANCE DATA

Compare response times by region to pinpoint degradation.

Featured Capabilities

Multi-Region ChecksFalse-Positive FilteringRegional Latency DataCloud RedundancyAutomatic Failover
Reliable checks from every region

5 AI agents investigate and fix incidents for you

RESPONDER DETECTS DOWNTIME

The Responder agent detects downtime across your monitors and immediately notifies the other agents to begin investigation and remediation.

ANALYZER FINDS ROOT CAUSE

The Analyzer agent cross-references uptime failures, error logs from your error tracking tools, and traffic data from your analytics platforms to identify root cause.

FIXER RESOLVES AUTOMATICALLY

The Fixer agent executes automated remediation workflows — restarting services, triggering failovers, and rolling back deployments. Billed at $1.00 per confirmed resolution.

WATCHDOG MONITORS BASELINES

The Watchdog agent continuously monitors for deviations from baseline behavior and escalates anomalies to Analyzer before they become outages.

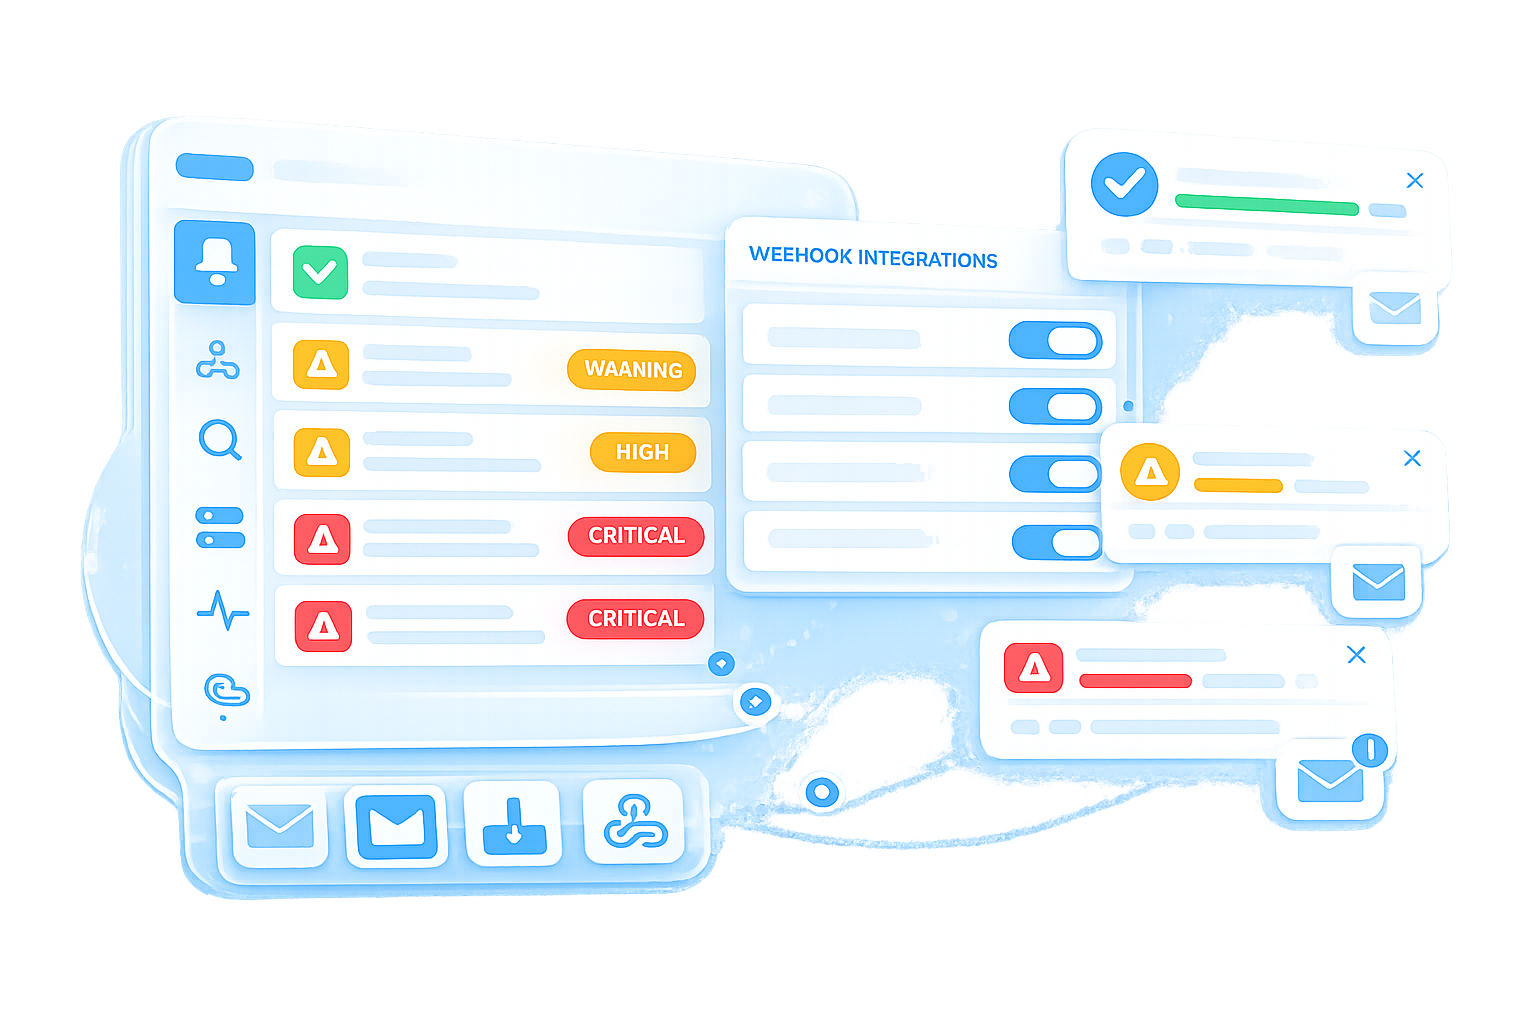
MESSENGER ALERTS YOUR TEAM

The Messenger agent routes alerts to the right people via email, SMS, team chat, and custom webhooks.

Featured Capabilities

Responder — Detects downtimeAnalyzer — Root cause analysisFixer — Automated remediationWatchdog — Baseline monitoringMessenger — Alert routingAI analyses at $0.15 each
5 AI agents investigate and fix incidents for you

Applications

Manage uptime from web, desktop, and mobile

Native desktop clients for Windows, macOS, and Linux to manage monitors, incidents, and on-call workflows from one focused workspace.

WindowsmacOSLinux

Use Uptivus from any modern browser with no installs. Build monitors, track incidents, and publish status updates from anywhere.

ChromeFirefoxSafariEdge

Stay on top of incidents with Android and iOS apps. Receive push notifications and review current monitor health on the go.

AndroidiOS
Uptivus desktop application preview
Uptivus DesktopNative desktop monitoring for Windows, macOS, and Linux
Uptivus web application preview
Uptivus WebMonitor uptime from any modern browser
Uptivus mobile application preview
Uptivus MobileIncident visibility on Android and iOS

Continue Reading

Explore More

“AI employee” refers to Uptivus's AI-powered software assistant. It is not a human worker or legal employee.

Free plan includes 5-minute monitoring intervals. All paid plans include 60-second monitoring intervals. Prices and features may change before public release. No orders or pre-orders are currently accepted.

All third-party company names, logos, and trademarks referenced on this site are the property of their respective owners and are used solely to describe compatibility and supported integrations. Fluenik, LLC and Uptivus are not affiliated with, endorsed by, or sponsored by any of the companies listed.